The first column, N, is the number of items in a data set.
The other four columns are mathematical functions based on the size of N. In computer science, we write this with a capital O (order) instead of the traditional F (function) of mathematics. This type of notation is the order of an algorithm, or Big O notation.
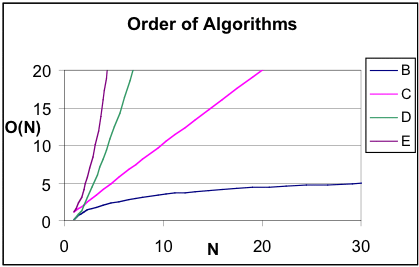
The graph below, Order of Algorithms, gives a clearer sense of the relationships among the columns of numbers. Since the vertical axis represents the theoretical number of steps required by an algorithm to sort a list of N items, lines B and C represent more efficient algorithms than D and E. Today’s data sets can grow to enormous sizes, so algorithm designers are always searching for ways to reduce the number of steps, even on the fastest supercomputers.

You have already seen column E in an experimental sense when you counted the number of steps in the quadratic sorting algorithms. The relationship between columns A and E is quadratic - as the value of N increases, the other column increases as a function of N2. The graph of column E is a portion of a parabola.
